
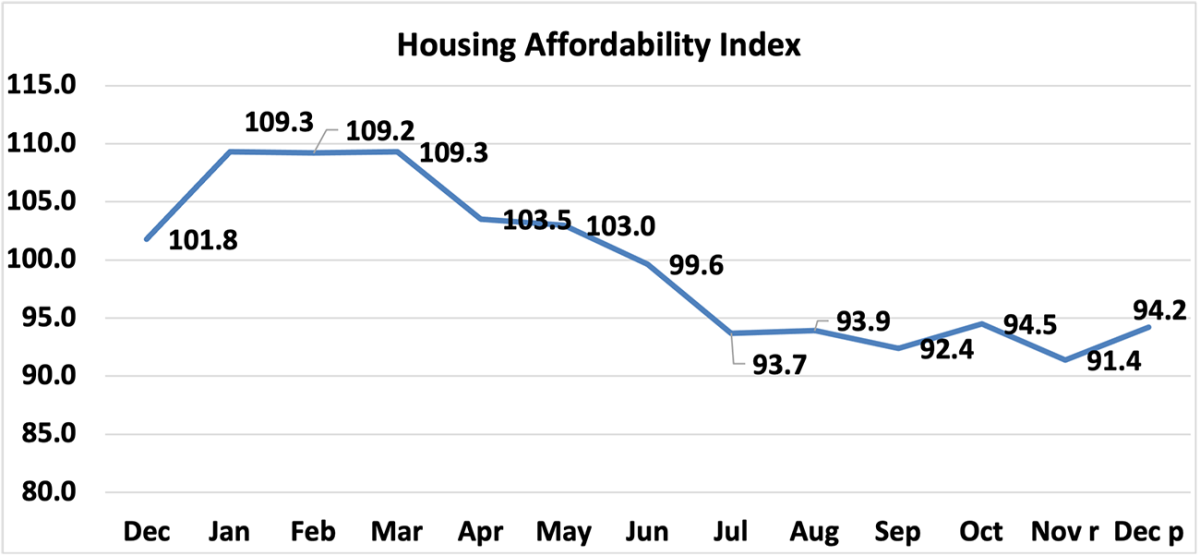
At the national level, housing affordability improved in December compared to the previous month, according to NAR’s Housing Affordability Index. The monthly mortgage payment decreased by 7.2% compared to the prior month, while the median price of single-family homes declined by 1.3%. The monthly mortgage payment decreased $159 from last month.
Compared to one year ago, affordability fell in December as the monthly mortgage payment climbed 9.1% and median family income rose by 1.7%. The effective 30-year fixed mortgage rate was 6.90% this October compared to 6.44% one year ago. Nationally, mortgage rates were up 46 basis points from one year ago (one percentage point equals 100 basis points). Mortgage rates moved below 7% for the first time since July 2023. The median existing-home sales price rose 4.0% (from $387,000, compared to one year ago, at $372,000).


The national index is currently below 100, which means that a family with a median income had less than the income required to afford a median-priced home. The income required to afford a mortgage, or the qualifying income is the income needed so that mortgage payments on a 30-year fixed mortgage loan with a 20% down payment account for 25% of family income.
The most affordable region was the Midwest, with an index value of 138.5 (median family income of $97,359 with a qualifying income of $70,272). The least affordable region remained the West, where the index was 72.5 (median family income of $108,777 and the qualifying income of $150,048). The Northeast was the second most affordable region with an index of 101.4 (median family income of $111,828 and qualifying income of $110,304). The South was the second most unaffordable region with an index of 101.3 (median family income of $91,809 with a qualifying income of $90,624).
A mortgage is affordable if the mortgage payment (principal and interest) amounts to 25% or less of the family’s income.


Housing affordability declined in all four regions from a year ago. The Northeast region had the biggest decline of 11.7%, followed by the Midwest with a dip of 8.3%. The West experienced a weakening in price growth of 7.2%, followed by the South, which fell 6.2%.
Affordability fell in all four regions from last month. The West region had the biggest dip, 9.1%, followed by the Midwest with a decline of 3.2%. The Northeast region had a decrease of 8.1%, followed by the South region, which had the smallest drop of 6.7%.
Compared to one year ago, the monthly mortgage payment fell to $2,039 from $1,869, an increase of 9.1% or $170. The annual mortgage payment as a percentage of income inclined to 24.5% this December from 22.9% a year ago. Regionally, the West has the highest mortgage payment to income share at 34.5% of income. The South and the Northeast shared the second highest share at 24.7%. The Midwest had the lowest mortgage payment as a percentage of income at 18.0%. Mortgage payments are not burdensome if they are no more than 25% of income.


The job market is improving, which is always a good sign for the economy. Mortgage rates have continued on a downward trend, which has been helpful for monthly mortgage payments. Home price growth has also stabilized over the last few months, which is good going into the spring homebuying season.
Read the data release.
The Housing Affordability Index calculation assumes a 20% down payment and a 25% qualifying ratio (principal and interest payment to income). See further details on the methodology and assumptions behind the calculation.