
The National Association of REALTORS® reported that home prices continued to rise in the fourth quarter of 2023, and single-family home prices had positive gains in 85.5% of 221 metro areas. National median prices rose 3.5%, year over year, to $391,700. Median home prices fell by 3.6% compared to the previous quarter. Of the 221 metro areas, 15% had double-digit year-over-year price increases in the fourth quarter of 2023.
Monthly mortgage payments on a single-family home in the fourth quarter increased 10.0% to $2,163 compared to $1,967 from a year ago. Qualifying median family incomes fell to $103,835 compared to the third quarter of 2023 ($105,060) but was $94,438 a year ago. The effective 30-year fixed mortgage rate increased to 7.37% in the fourth quarter of 2023 compared to 6.77% one year ago. Median family incomes rose to $99,436 in the fourth quarter of 2023 compared to $97,514 a year ago.
Knowing the mortgage rates and the qualifying incomes for down payments will help potential homeowners figure out what metro areas are affordable for them.
Here is a look at the metro areas with the strongest price growth in the fourth quarter of 2023, as well as a look at the yearly change in median existing single-family home prices among the top five highest- and lowest-growth metro areas.
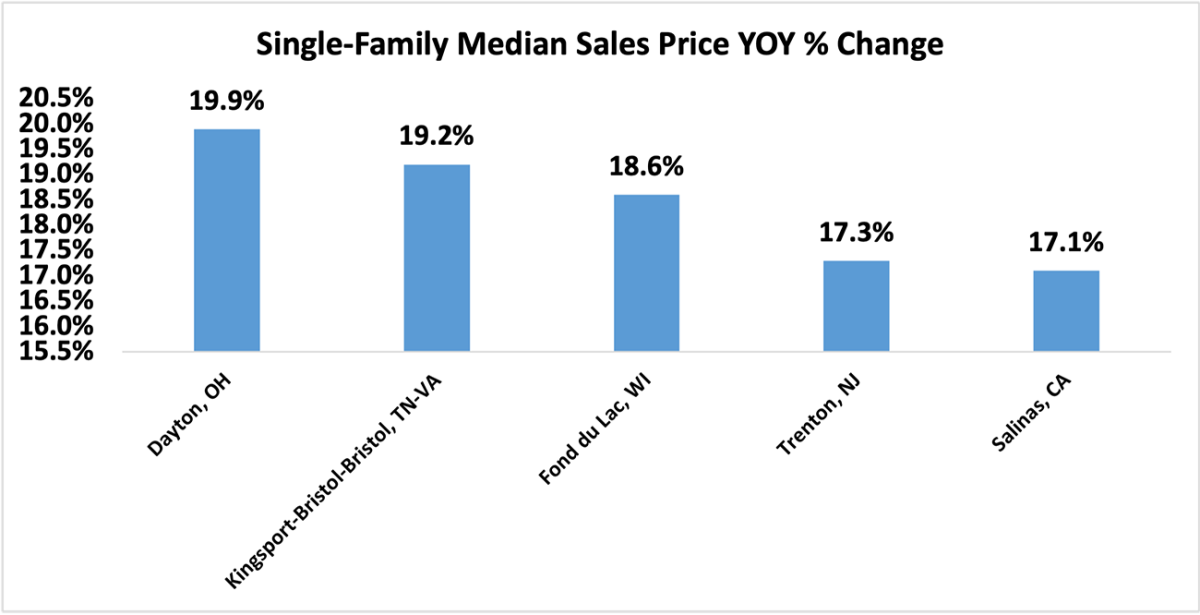
The top five single-family metro areas with the highest home price appreciation year-over-year were Dayton, OH (19.9%); Kingsport-Bristol-Bristol, TN-VA (19.2%); Fond du Lac, WI (18.6%); Trenton, NJ (17.3%); and Salinas, CA (17.1%).
The bottom five single-family metro areas with the slowest home price appreciation were Punta Gorda, FL (-5.5%); Akron, OH (-5.6%); Naples-Immokalee-Marco Island, FL (-5.9%); Cleveland-Elyria, OH (-8.6%); and Jackson, MS (-14.1%).

The five most expensive metro areas for the fourth quarter of 2023 were San Jose-Sunnyvale-Santa Clara, CA ($1,750,000); Anaheim-Santa Ana-Irvine, CA ($1,300,000); San Francisco-Oakland-Hayward, CA ($1,251,000); Urban Honolulu, HI ($1,069,000); and Salinas, CA ($994,000).

The least expensive metro areas for the fourth quarter 2023 were Cumberland, MD-WV ($150,000); Youngstown-Warren-Boardman, OH-PA ($146,000); Peoria, IL ($144,000); Elmira, NY ($143,000); and Decatur, IL ($125,000).

Qualifying Income Based on Sales Price of Existing Single-family Homes for Metropolitan Areas by Region
For the U.S., at the 5% down payment threshold, the income required to qualify for a mortgage for the fourth quarter of 2023 was $123,304. At the 10% down payment mark, qualifying income was $116,815; with a 20% down payment, qualifying income was $103,835. The West led all regions with the highest qualifying income, while the Midwest had the lowest income for 5%, 10%, and 20% down payments on a single-family home.
